Estimating expected epiphytic macrolichen diversity in North America
Bruce McCune and Sunia YangFebruary 2021
Introduction
The purpose of this work was to build a model to estimate epiphytic macrolichen diversity in forested areas of the continental U.S. We envisioned that these estimates would be useful for the following:
- Documenting effects of air quality and climate change.
- Understanding what drives lichen biodiversity.
- Providing a basis for estimating functional contributions of lichens to forest ecosystems.
- Online education in lichenology: providing expected values for species richness in lichen plots for observers-in-training anywhere in the country.
Data source
We used lichen community data collected at Forest Inventory and Analysis (FIA) plots (McCune 2000). The years of data collection span from 1993 to 2017 (USDA 2021). The data set includes 6474 plots in forested areas of the continental U.S. Each plot is 0.4 hectares (about 1 acre). Field personnel collected a complete set of epiphytic macrolichens from each plot. These specimens were then identified by lichen specialists. Most specimens are housed in the herbarium of Oregon State University (OSC). This program is highly unusual in having all data points vouchered and examined by a lichen specialist.
Modeling species richness
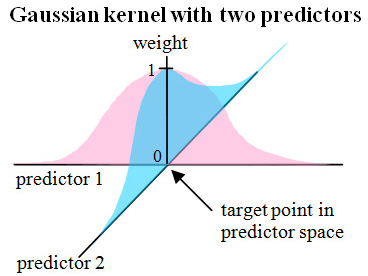
We used nonparametric regression to model species richness as a function of latitude and longitude. The model was fit with a multiplicative kernel smoother (NPMR) using the software HyperNiche (McCune & Mefford 2009). We chose a local mean estimator with Gaussian kernel (figure at right), the smoothing parameters optimized to maximize the cross-validated fit, subject to overfitting constraints. The minimum average neighborhood size for an acceptable model was set to 3, with the minimum neighborhood size for an estimate set to 1.
We know that if you actually visit a particular plot, the observed value will vary around the expected local mean. To describe this variability we calculated 10th and 90th percentiles for the estimates based on bootstrap resampling, using 100 bootstrap samples of N=6474 plots, each bootstrap sample selected with replacement.
This method has the advantages of not assuming a uniform error structure around a regression line or surface and mimicking as much as possible the whole process of sampling-to- modeling. We penalized overfitting by crossvalidation during the every phase of the model fitting process.
This method provides a variability band for the local mean, but we sought a variability band for individual observations, so that individuals visiting particular plots could compare their observed value to an expected range of values.
One standard error equals the span between the 90th and 10th percentiles divided by 2.56, invoking the central limit theorem and assuming that the estimates of the mean are normally distributed. We then estimated the standard deviation of the observations as the standard error divided by the square root of N*, where N* is the local neighborhood size averaged across the bootstrap runs. Finally, we estimated the 10th and 90th percentiles of the observations as +/- 1.28 standard deviations from the local mean.
Possible reasons for lower richness values than expected include poor observers or a local factor that reduced richness (e.g. disturbance, unusual environmental conditions for that area). Conversely, possible reasons for higher richness than expected include particularly astute observers or local factors that promote lichen species diversity, such as old stand ages, diversity of tree species, nearby bodies of water, or “enforced” canopy gaps (e.g. by rock outcrops, talus slopes, wetlands).
Expected species lists
We also enumerated the species found in nearby plots. We tallied species occurring in plots within 10, 50, and 100 km of a the target point (plot center). Species lists are presented as comma-separated value lists with acronym, species name, and number and percentage of plots supporting that species within the search radius. These list are easily cut/pasted into spreadsheets or imported into other software.
Acknowledgements
We thank Sarah Jovan and Linda Geiser, who orchestrated the sampling and data management programs for many years; Rob Smith, who extracted and provided clean data files; hundreds of field people collecting the field samples; dozens of lichenologists for identification work; and the USDA Forest Service for funding the lichen programs.
References
McCune, B. 2000. Lichen communities as indicators of forest health. Bryologist 103: 353-356.
McCune, B. and M. J. Mefford. 2009. HyperNiche. Nonparametric Multiplicative Habitat Modeling. Version 2. MjM Software, Gleneden Beach, Oregon, U.S.A.
USDA 2021.
United States Forest Service National Lichens & Air Quality Database and
Clearinghouse. http://gis.nacse.org/lichenair/ (accessed 3 February 2021)